
THE SOVEREIGN LEDGER™ · REPORT #202 · NOVEMBER 2026
The 0.0145% Illusion: Why Smart Capital Is Abandoning Legacy Cable for 1.75B+ Sovereign Scale
The Great Capital Flight: Why Elite Marketers Are Abandoning Legacy Cable Networks for Sovereign Digital Infrastructure
From rented attention to owned relationships: the ten-year distribution shift, November 2026 cable-news evidence, and the investment case for Limitless USA LLC and REALATAR™.
Geoff De Weaver · Research and strategic brief · Friday, November 13, 2026 (ET) · New York · Palm Beach · Miami · Naples · Sarasota · Tampa
Ultra-high-net-worth allocators and enterprise CEOs operate on hard math, not media hype. So I lead with the math. The top-rated cable-news broadcast in the most prized advertising demographic, on the most recent detailed night of data I hold, equals a rounding error against the visibility I have built. That reframes legacy cable advertising from a matter of taste into a matter of capital allocation: the kind of stewardship question every CFO, CMO and family-office principal should be able to answer in front of a board.
What You Gain From This Report
- A board-ready test for every media renewal. Judge each channel on cost per qualified outcome, with the same accounting standard applied to all of them, including mine.
- The latest numbers, kept honest. November 9 daily data, the October monthly result, the Q2-to-Q3 trend and a ten-year view of pay-TV distribution.
- Language that no sales deck can blur. Clear lines between footprint and reach, impressions and people, engagement and pipeline.
- A practical route to assets you keep. Research, permission, relationships and provenance that keep working after the media flight ends.
- A direct line to dialogue. A clear next step for CEOs, family offices, UHNWIs and venture capitalists who want to test the proposition against their own mandate.
1The capital-allocation question has changed
For more than four decades, I have worked at the intersection of advertising, brands, technology and distribution. From the early commercial internet to today’s AI-enabled publishing and programmable ownership systems, the enduring challenge has been the same: connect the right opportunity with the right decision-maker, at a cost the resulting business value can justify.
In 2026, that challenge demands a harder examination of legacy television. The prestige of a familiar network cannot substitute for evidence of commercial performance. A large share of a constrained audience does not automatically mean broad market coverage. A recognizable presenter does not establish access to the people who can approve an investment, acquire an asset or transform an enterprise.
My position is direct: build assets that survive the campaign: authoritative research, permissioned relationships, useful data, repeat engagement and distribution they can direct. Advertising can help create those assets, but buying exposure alone does not establish ownership of the customer relationship.
I have watched distribution power move through successive technology cycles. Traditional pay-TV has contracted, streaming has gained viewing time, and the growth in advertising capital has shifted toward digital formats. I judge television placements by their contribution to the business, including during news-driven audience surges. Familiarity earns no automatic budget allocation. Performance earns it.
For a billionaire principal, a family-office director or an enterprise CEO, the issue reaches beyond a media plan. It concerns who controls the explanation of your business, where your institutional knowledge accumulates, and whether the next prospective partner can find a coherent record of your work. Those are management decisions with consequences long after the next advertising flight ends. I am building Limitless USA around that longer horizon.
The question for a CEO or CMO is therefore precise: what does each additional dollar create, and what remains after the placement ends?
I develop that ownership argument throughout The Sovereign Ledger™ institutional research series. For this report, I apply it to a concrete management problem: how much of your distribution budget creates a continuing asset, and how much simply purchases another temporary appearance?
2November 9: a narrow total-viewer lead and a different demo winner
I begin with the November 9, 2026 scorecard, attributed to Nielsen Big Data + Panel, Live + Same Day. My primetime calculations average its displayed 8 p.m., 9 p.m. and 10 p.m. hours. The source includes preliminary panels, and the resulting averages are rounded. [1]
| Network | Primetime average viewers | Adults 25–54 | Share of three-network total | Share of three-network demo |
|---|---|---|---|---|
| Fox News | 1,579,333 | 139,000 | 41.65% | 34.43% |
| MS NOW | 1,545,667 | 144,667 | 40.76% | 35.84% |
| CNN | 667,333 | 120,000 | 17.60% | 29.73% |
| Combined average | 3,792,333 | 403,667 | 100%* | 100% |
*Displayed percentages may differ slightly from 100% because of rounding.
Fox News led total viewers by approximately 33,667—only about 2.2% above MS NOW. MS NOW led adults 25–54 by approximately 5,667. CNN had the smallest total audience but the highest demo proportion: approximately 18.0%, compared with 8.8% for Fox and 9.4% for MS NOW.
My buying discipline starts here: define the commercial objective before celebrating the leaderboard. Total audience, age composition, relevant decision-maker concentration and conversion are different measures. Adults 25–54 is an advertising demographic, not a proxy for billionaire wealth, investment authority or CEO seniority. Older viewers can be highly relevant to luxury, property and wealth-management campaigns.
The combined 3.79 million figure is a sum of network averages. It is not deduplicated nightly reach. The 42%, 41% and 18% figures describe shares among these three networks, not shares of all Americans or all television viewing. Newsmax and NewsNation are excluded from the supplied daily charts.
3What the program rankings actually reveal
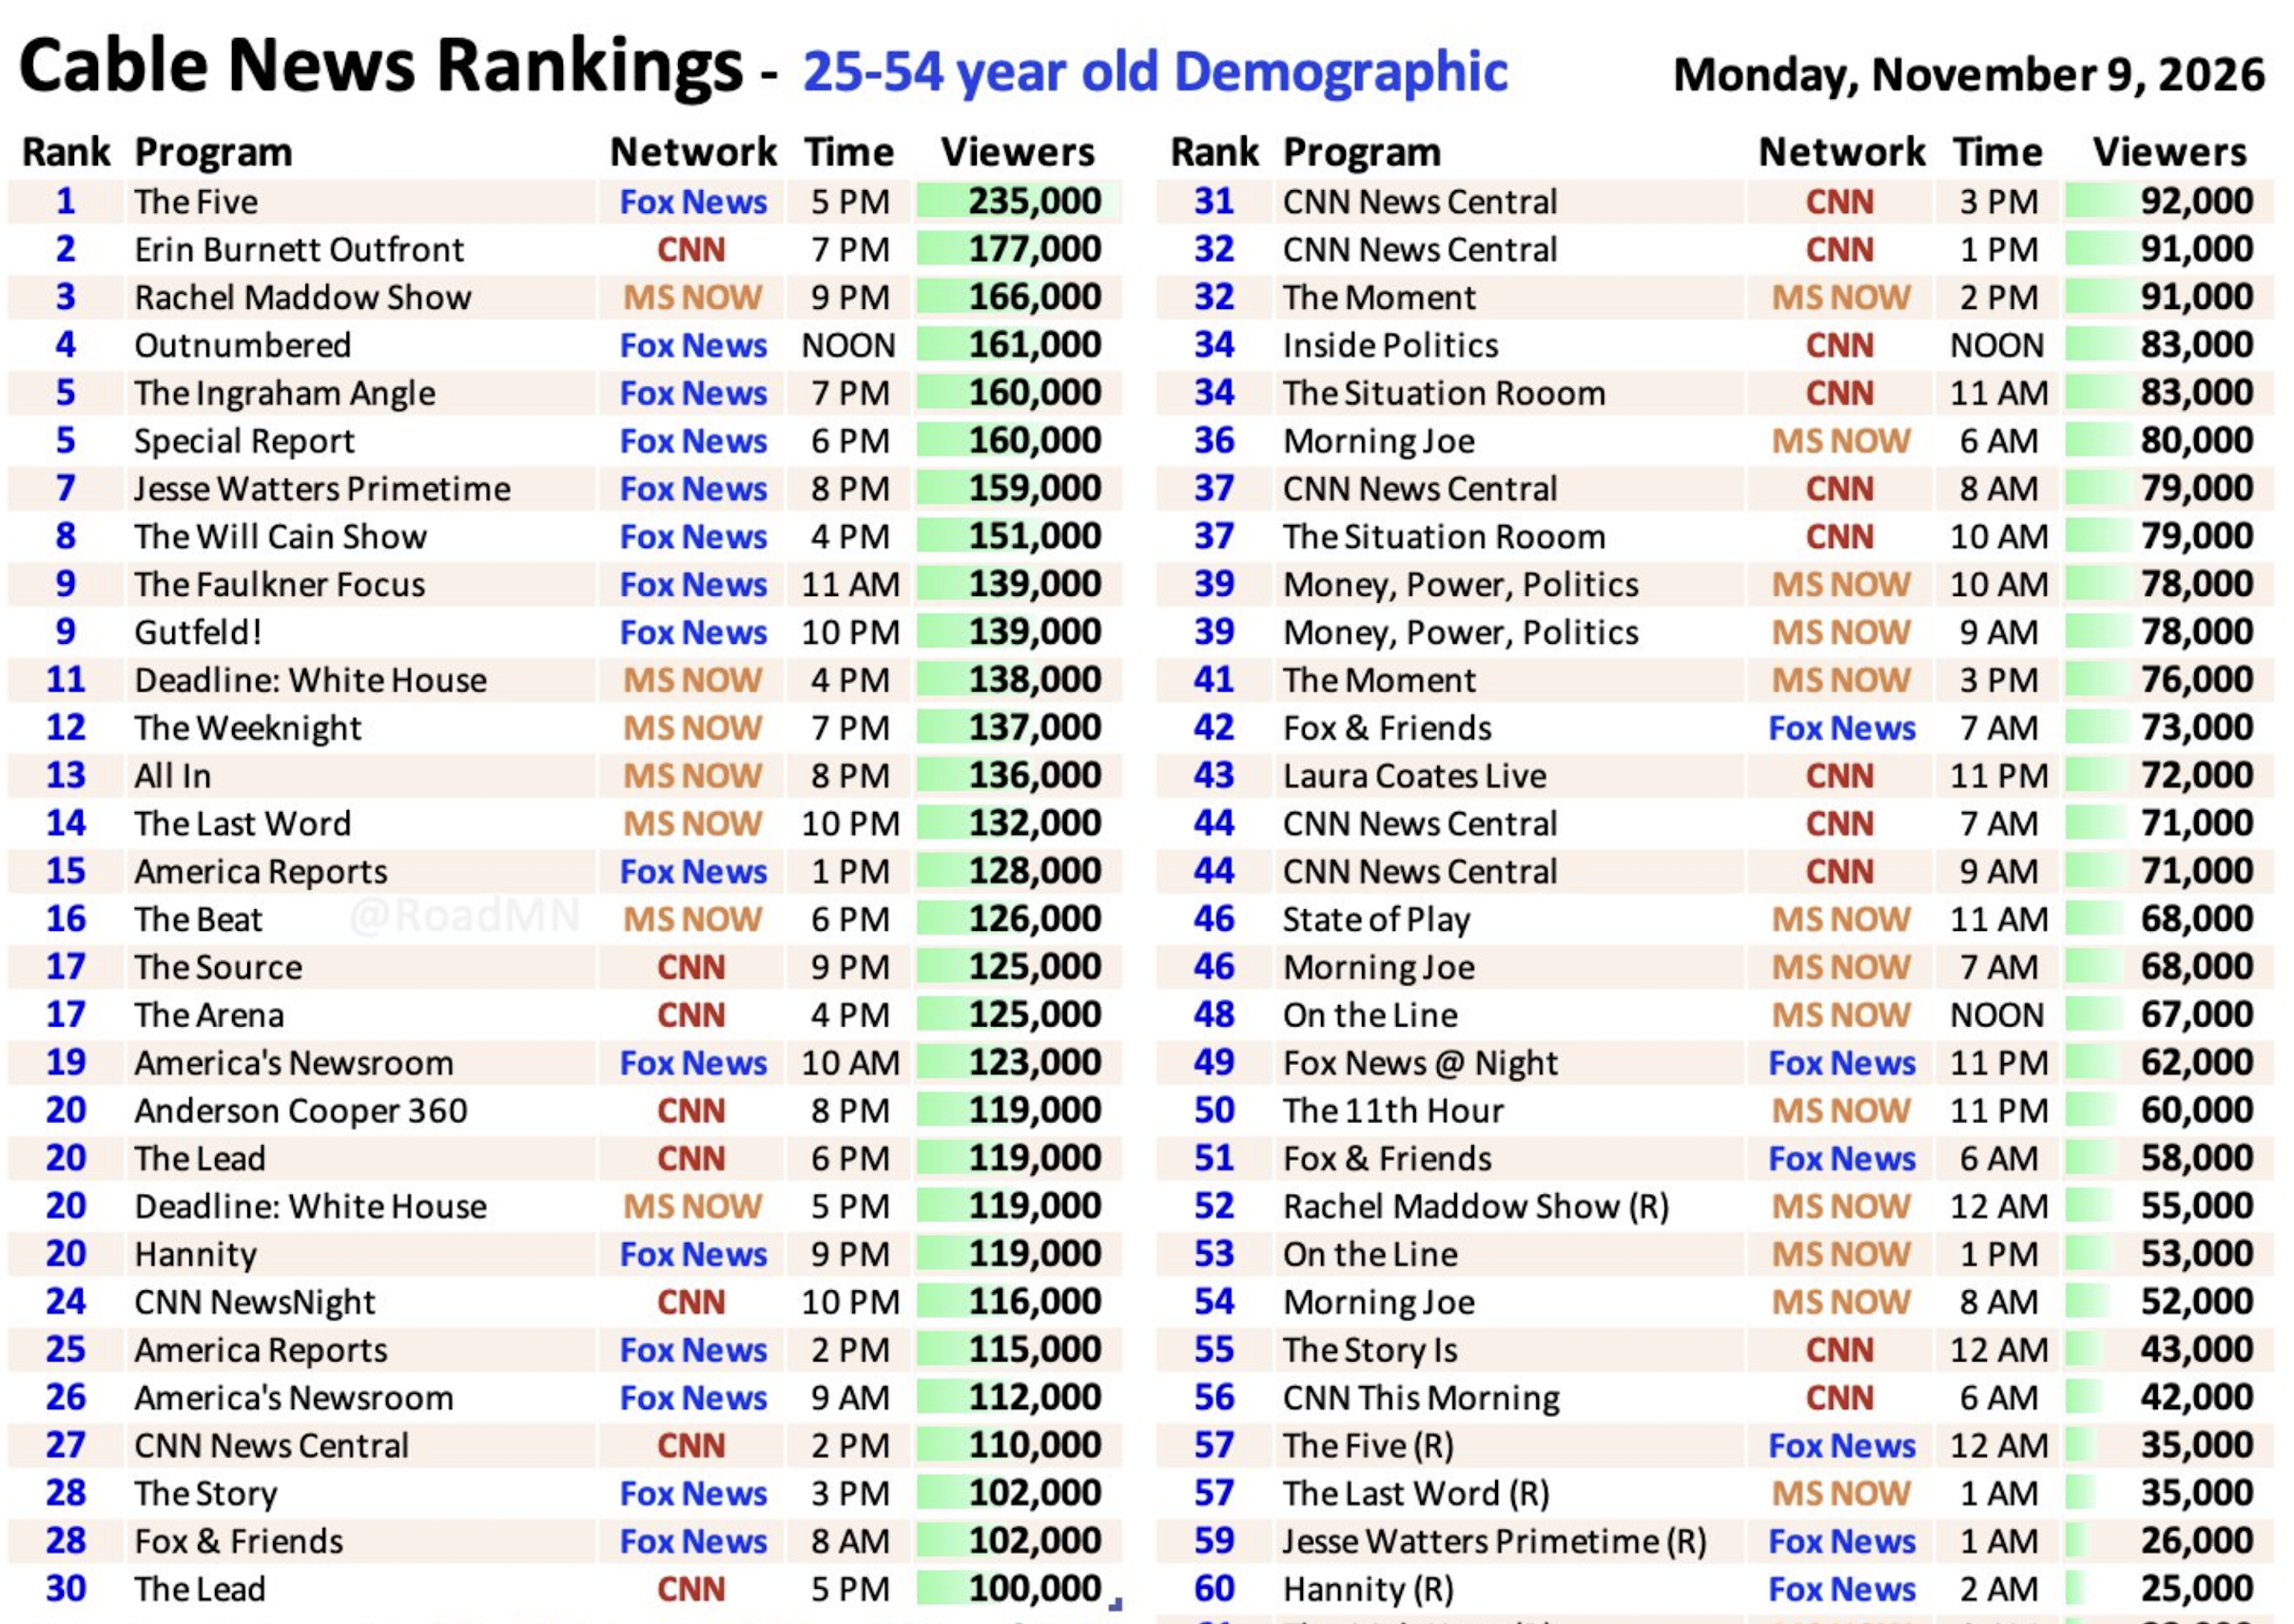
The Five led the supplied program ranking with 2.667 million total viewers and 235,000 adults 25–54. Its 54% total share and 52% demo share apply to the three-network comparison at 5 p.m. It is outside the charts’ 8–11 p.m. primetime window. [1]

At 9 p.m., Rachel Maddow led the three-network hour with 1.904 million total viewers and 166,000 in the demo. At 7 p.m., Erin Burnett recorded 177,000 demo viewers, ahead of the competing Fox and MS NOW programs. A network’s overall position can conceal commercially important individual programs.
The lowest-share examples also require their proper context. The Lead at 5 p.m. and CNN NewsNight at 10 p.m. each recorded a rounded 16% total-viewer share. Anderson Cooper’s 16% demo share applied to a 2 a.m. repeat, with 9,000 demo viewers—not the original 8 p.m. broadcast. The original recorded 119,000 demo viewers and a rounded 29% share.
The supplied dayside table shows Fox leading total viewers in every listed hour from 7 a.m. through 3 p.m.; MS NOW led at 6 a.m. Fox did not beat the other two combined in those dayside total-viewer slots. Leading each rival and exceeding both together are different achievements.
I focus on what these rankings mean for the buyer. A household name can command attention while a less celebrated slot delivers a stronger audience match. My responsibility as a strategist is to expose that difference and make the allocation earn its place. Inventory quality, relevance and price decide the commercial argument.
| Demo rank | Program | Adults 25–54 |
|---|---|---|
| 1 | The Five | 235,000 |
| 2 | Erin Burnett OutFront | 177,000 |
| 3 | The Rachel Maddow Show | 166,000 |
| 4 | Outnumbered | 161,000 |
| 5, tied | The Ingraham Angle / Special Report | 160,000 each |
| 7 | Jesse Watters Primetime | 159,000 |
| 8 | The Will Cain Show | 151,000 |
| 9, tied | The Faulkner Focus / Gutfeld! | 139,000 each |
My program comparison uses the November 9 snapshot. The separate CNN 7 a.m. discrepancy is recorded in the source notes; the primetime calculations and leading programs shown here are unaffected.
4From June to November: read the direction and the volatility
I compare the June monthly benchmark, the Q3 quarterly summary, the October monthly result and the latest supplied November 9 daily observation. Keeping each window visible lets a marketer see both the scale of the audience and its sensitivity to the calendar, programming and news cycle.
| Network | June 2026 primetime total | Q3 2026 primetime total | October 2026 primetime total | November 9 primetime total |
|---|---|---|---|---|
| Fox News | 2,260,000 | 2,060,000 | 1,675,000 | 1,579,333 |
| MS NOW | 1,015,000 | 930,000 | 925,000 | 1,545,667 |
| CNN | 610,000 | 607,000 | 598,000 | 667,333 |
Sources: ADWEEK/TVNewser for June and October; TV Insider for Q3; supplied November 9 ratings graphics. Monthly, quarterly and daily averages are different observation windows. [1–3, 15]
Relative to June’s monthly average, this Monday’s totals were approximately 30.1% lower for Fox, 52.3% higher for MS NOW and 9.4% higher for CNN. These different observation windows expose volatility. My structural thesis rests on the distribution evidence across years; this Monday tells me how the audience was divided on that date.
The October monthly result adds a cleaner like-for-like comparison with June. Fox’s October primetime average was approximately 25.9% below its June level; MS NOW was about 8.9% lower and CNN about 2.0% lower. ADWEEK’s quarterly figures show the same direction from Q2 to Q3 2026: primetime total viewers fell approximately 17.2% at Fox, 12.2% at MS NOW and 14.5% at CNN. [15–16]
TV Insider reports Q3 year-over-year primetime total-viewer changes of −17% for Fox, +16% for MS NOW and +12.8% for CNN. Demo changes were −24.7%, +27.3% and +16.1%, respectively. [3]
One more signal deserves a buyer’s attention. NewscastStudio reported a 27% decline in Fox’s October 2026 total-day viewership, putting the network on pace for its lowest monthly total-day audience since December 2023. When asked about its television ratings, the company pointed to its digital performance: 3.8 billion YouTube views from the start of 2026 through October 27, according to Emplifi data it supplied. [17] When the category leader answers a television question with digital numbers, the market has told you where attention is now being counted.
My warning to marketers is straightforward: buy the audience and outcome your business needs. Reprice your assumptions as delivery changes. A historic ranking is a weak substitute for a current buying case. The strategic conclusion is mine, drawn from the published ratings and the operating economics of distribution.
5The ten-year distribution story is stronger than a one-night ratings argument
I put the greatest weight on the distribution base. A compelling hour of television can win a night. A distributor losing millions of customers is facing a different, longer-term operating reality.
| Evidence window | Earlier observation | Later observation | What it establishes |
|---|---|---|---|
| Major pay-TV providers, 2016–2023 | 93.6m subscriptions | 71.3m subscriptions | Roughly 22.3m fewer reported subscriptions; includes internet-delivered bundles |
| Traditional services within those totals | About 92.2m | About 55.1m | Approximately 40.2% contraction in reported traditional subscriptions |
| Comcast video, year-end 2016–September 2026 | 22.508m customers | 10.394m domestic customers | Approximately 53.8% decline over nearly ten years |
| U.S. adult cable/satellite use, 2015–2021 | 76% | 56% | A 20-percentage-point decline in survey-reported use |
Sources: Leichtman Research Group, Comcast and Pew. Provider coverage and reporting definitions differ; these rows are separate indicators, not one continuous series. The 2016 and 2023 LRG samples covered approximately 95% and 96% of their respective markets. Comcast is one distributor, not a census of the entire industry. [4–8]
Comcast’s latest reported domestic video total was also approximately 9.7% below its September 2025 level. That makes the erosion a current operating fact, not merely a historical narrative. Subscriber losses reduce the traditional distribution base, but do not translate one-for-one into lost viewers or advertising revenue for a particular news channel. [7]
The next stage is a shift in viewing behavior. Nielsen reported that streaming captured 44.8% of television viewing in May 2025, exceeding broadcast and cable combined at 44.2%. Relative to May 2021, cable viewing had declined 39%, while streaming usage had increased 71%. These are television-screen viewing measures, not shares of all digital attention. [9]
The decade can therefore be understood as overlapping changes: traditional subscription erosion; greater consumer choice; streaming growth; and a weakening assumption that national attention must pass through a small number of linear channels.
Comcast’s two endpoint figures translate into 12.114 million fewer video customers, leaving approximately 46.2% of its 2016 base. Nielsen’s May 2025 comparison puts streaming 0.6 percentage points ahead of broadcast and cable combined. These are different measures, but both sharpen my allocation question: where should the next distribution investment create enduring value?
6Cable-news demand has cycles inside that structural decline
I separate the news cycle from the distribution cycle. Pew’s Comscore series shows why: exceptional events can generate substantial viewing even as the underlying subscription model loses ground. [10]
| Year | CNN | Fox News | MSNBC |
|---|---|---|---|
| 2016 | 1,347,499 | 1,881,928 | 975,885 |
| 2020 | 1,803,782 | 3,082,961 | 1,597,577 |
| 2022 | 828,073 | 2,147,100 | 827,182 |
These are annual averages of televisions tuned to prime news, using Comscore’s live-viewing definition. They are not Nielsen person counts and must not be spliced into the November 2026 viewer table as a single series. MSNBC has since been renamed MS NOW.
The series demonstrates a surge in 2020 and subsequent declines, with Fox’s 2022 level still above 2016. The distinction strengthens the strategic case. A distribution system can lose subscriptions while news events temporarily lift viewing. Likewise, network profitability and advertiser profitability are separate questions: affiliate fees, pricing, costs and digital businesses affect the former; incremental sales and customer value determine the latter.
7Follow the growth in capital and build an ownership advantage
Dentsu’s May 2026 forecast projects digital at 69% of global advertising expenditure. Its format forecasts include 11.5% growth for connected TV, 8.7% for digital video and flat growth for linear television. These are global forecasts, not observed U.S. cable-news budget withdrawals. [11]
I read these forecasts as a clear signal about where incremental advertising investment is being sought. Connected TV can strengthen established media companies; digital growth can also deepen dependence on major platforms. My response is to build an owned destination capable of retaining the knowledge, permission and relationships that distribution generates.
My strategic proposition goes further than moving a television budget onto another platform. Brands should use appropriate paid distribution to build a durable, permissioned relationship with their audiences. Otherwise, the intermediary changes while the dependence remains.
My Global Advertising Strategy 2026 (#198) is the companion reading for that allocation debate: it shows how to compare every channel on cost per qualified outcome and run a 90-day pilot before committing a full budget. I connect it to the broader ownership work in The Sovereign Ledger™, where the strategic priority is retaining control over the assets that distribution helps create.
8The capital-efficiency test: make every dollar answer for itself
Cost efficiency concerns the cost of delivering a specified unit, such as a valid impression or qualified visit. Cost effectiveness concerns the cost of achieving an outcome, such as an incremental customer or profitable transaction. A channel can improve one while worsening the other.
For delivered advertising impressions:
CPM = actual advertising cost ÷ delivered impressions × 1,000
| Illustrative scenario | Price change | Delivered-impression change | CPM change |
|---|---|---|---|
| Audience delivery weakens; price holds | 0% | −20% | +25.0% |
| Delivery weakens; price rises | +10% | −20% | +37.5% |
| Price tracks reduced delivery | −20% | −20% | 0% |
These scenarios explain the risk of paying more per impression; they are not observed prices for Fox, MS NOW or CNN. Actual contracts can include guarantees, makegoods, package discounts and different commercial-audience measures. Program ratings are not automatically the impressions delivered by an individual advertisement.
I require actual prices, delivered advertising impressions and commercial results before renewing a major allocation. That standard cuts through an impressive sales presentation. The figures I want are the effective cost after discounts and makegoods, the relevant audience delivered, and the incremental business created.
My conclusion is practical: a shrinking delivery base places greater pressure on every remaining advertising dollar to prove its value. Buyers should renegotiate assumptions, measure incremental outcomes and stop renewing budgets merely because a channel is familiar.
Five Questions to Ask Before You Renew a Cable Buy
- What was the effective CPM after discounts and makegoods, and how did it move as delivery changed?
- How many of the delivered impressions reached the decision-makers this business actually needs?
- What incremental revenue or qualified pipeline can we attribute to the spend, measured against a holdout?
- What does the business still own when the flight ends: contacts, permission, research, data?
- Would the same budget, held to the same standard, build a continuing asset elsewhere?
9My 1.62B+ Footprint: Defining Institutional Scale and Multi-Decade Velocity
Limitless USA LLC operates from my current 1.62B+ indexed global network and search-visibility footprint, with 1.75B+ targeted by December 31, 2026. The next milestone adds 130 million to the headline footprint, approximately 8.0% above the current baseline. I am pursuing that expansion through continued publishing, distribution and executive engagement. The ambition is explicit, and I intend to keep the measurement equally explicit.
I use “footprint” in the sense defined on my published Ledger: aggregate indexed visibility derived from multi-platform Boolean search-result snapshots. Television ratings measure estimated viewing during a defined interval. My search-visibility measure describes a different dimension of distribution. Executive relationships, qualified engagement and campaign delivery each have their own operational records. Defining those measures clearly gives an institutional reader a stronger basis for assessing the opportunity.
My velocity comes from a long operating history. My Web1 experience includes work associated with OzEmail during its 1996 NASDAQ era and the 1999 San Francisco chapter in which I launched Omnicom Group’s first West Coast digital interactive agency. In my account of that build, the business grew to 34 specialists in nine months, with $2 million in profit before tax and a 35% operating margin. Those figures describe my historical agency execution. They explain the commercial discipline I bring to today’s architecture: build capability, win relevant work, manage delivery and protect the economics. [14]
Across more than four decades and five continents, I have learned to recognize the moment when a familiar distribution model starts limiting a client’s ambition. Web1 introduced new routes to discovery and commerce. Web2 accelerated participation and network effects. AI now changes the speed at which intelligence can be produced, organized and applied. Programmable ownership adds another demanding question: who has the authority to act, and how is that authority recorded?
I bring that accumulated experience to the opportunity in front of us. My infrastructure strategy connects publishing, distribution, executive dialogue and the ownership workflows I am developing through REALATAR™. The value I seek is cumulative: better research informs better conversations, and better conversations sharpen the next research question.
| Strategic dimension | Linear cable benchmark | My Limitless USA ecosystem |
|---|---|---|
| Measurement | Estimated U.S. viewing in a specified window | Indexed global visibility, with engagement measured separately |
| Scale | The Five: 235,000 demo viewers on November 9 | 1.62B+ indexed footprint; 1.75B+ year-end target |
| Relationship model | Purchased advertising exposure | Discovery followed by permissioned executive dialogue |
| Institutional asset | Campaign creative and resulting brand effects | Retained research, direct contacts and reusable operating knowledge |
| Commercial test | Incremental business attributable to spend | Qualified relationships and outcomes relative to full operating cost |
The numbers deserve perspective. The Five’s 235,000 demo viewers equal 0.0145% of 1.62 billion as arithmetic; its 2.667 million total viewers equal 0.1646%. These are comparisons of numerical magnitude across different units, not audience-share or performance ratios. My commercial case rests on what I can build and activate around the footprint: relevant discovery, substantive executive engagement and relationships supported by a deep record of work.
For UHNWIs, billionaires, family offices, CEOs and VCs, the decisive question is whether the research helps them make a better decision and whether a direct conversation can move an opportunity forward. I design the journey around those requirements. The work must explain the issue, show the reasoning, make the commercial implications accessible and provide a clear route to dialogue.
The record behind that proposition is already substantial: 3,057,781+ words across 201 Sovereign Ledger™ reports, the established baseline before this entry. With this report, the record stands at 202 entries and 3,065,770+ verified words. Readers can inspect the research directly in The Sovereign Ledger™. The volume represents a sustained investment of intellectual effort; its business purpose is to help people understand difficult questions and act with greater clarity.
My earlier Global Distribution Advantage report provides a companion to this discussion; it is where I introduced Strategic Return on Attention™ and first set my distribution footprint against U.S. cable-news audiences. The current baseline is 1.62B+, superseding the older 1.55B+ figure in my historical artwork. On those headline values, the increase is 70 million, or approximately 4.5%. My next objective is 1.75B+ by the close of 2026. Each dated milestone belongs in the record, with its measurement method attached.
I have never operated at a larger indexed footprint. My task now is to turn that visibility, four decades of experience and sustained research into more valuable institutional relationships.
10Sovereign Distribution in Practice: The Command Center Architecture
My architecture places geoffdeweaver.com at the center of Primary Dialogue and Executive Intelligence. The Sovereign Command Center and Distribution Grid connects discovery channels to an authoritative destination where the full argument, the research record and the next conversation can live together. I want a prospective partner to move from a short public signal to a serious understanding of the work without depending on a social feed to reconstruct the story.
I use X, LinkedIn and other social destinations to create discovery and participation. My owned publishing base provides continuity. That division of responsibilities is intentional: each channel has a job, and the website retains the complete institutional argument. When a platform changes its algorithm, I can change the distribution plan while continuing to maintain the source material and direct relationships. I set out the control logic behind that design in The Global Distribution Control Layer™ (#171).
My operating model spans 10 platform categories and 14 personal and corporate destinations. These are distinct publishing and distribution routes, not 14 audiences that I simply add together. The strategic benefit is flexibility: I can introduce a thesis in a short format, explain it in a long report, discuss it directly with a qualified executive and preserve the resulting research improvements at the central source. [14]
The progression has three connected stages.
Sovereign control also has practical operating requirements. I prioritize control of publishing credentials, exportable content, recoverable backups, direct contact records and clear permissions. Hosting, cybersecurity and continuity need active management. The stronger the infrastructure, the more confidently I can keep a relationship moving when an external channel becomes less useful. Control is something I exercise through operating decisions every day.
Provenance is a distinct part of the architecture. My publication process uses SHA-256 document fingerprints and OpenTimestamps, with Bitcoin confirmation providing a verifiable time reference for the committed data. A completed proof lets a reader check that a matching document existed by the recorded time. I preserve the document and its proof together; publication access, backups and version management keep the research usable. This combines cryptographic evidence with practical stewardship. [12]
The business objective is durable authority that can be inspected and used. A decision-maker should be able to follow the reasoning, identify the relevant record and contact me directly about its application. My Sovereign Growth Loop report (#201) is the companion reading for the connection between intelligence, trust, relationships and ownership infrastructure.
That is my Command Center model: retain the authoritative work, direct the distribution, preserve the evidence and build the executive relationship.
11REALATAR™: connecting executive intelligence to ownership workflows
I connect this distribution strategy to REALATAR™ because ownership decisions demand more than attention. Property owners and institutional participants need confidence in who is involved, what authority they hold, what evidence supports an asset and which actions are permitted. In a global real-estate market forecast at roughly $625 trillion, those questions carry enormous economic weight. [18]
The proposed Sovereign Control Plane™ connects identity, ownership, capital, compliance, execution, settlement and provenance. Publishing can educate participants; qualified distribution can introduce relevant counterparties; controlled evidence access can support diligence. I design these functions to support the progression from understanding a problem to evaluating a practical solution. I set out the identity and delegated-authority layer in The Sovereign Control Plane™ Standard (#181).
For a property owner, the intended outcomes are understandable: greater control over disclosure, fewer avoidable handoffs, clearer authority and a shorter path from agreement to permitted settlement. For a partner, the evaluation should cover product readiness, integration requirements, permission controls, costs and demonstrated workflow improvements. The Intermediation Thesis™ (#199) shows how to find that avoidable friction and test it in a 90-day pilot.
My development standard is to demonstrate each workflow against a real customer need: establish authority, control access to evidence, identify the permitted action and record execution. Product readiness, legal requirements and integration belong in the implementation plan. They are central to building a system an institutional counterparty can use with confidence.
Readers assessing that development direction can follow the ownership research through The Sovereign Ledger™ entry index, starting with The Spatial Standard (#200). I want a prospective partner to arrive with informed questions about implementation, responsibility and customer value. That makes the first conversation more useful to both sides.
12A marketer’s test: prove the advantage with the same standard
I welcome a controlled commercial comparison. It is the strongest way to challenge an inherited allocation. Define one audience, one offer and one business objective. Apply the same cost accounting and outcome standards to every channel, including Limitless.
| Stage | Evidence to collect | Decision it supports |
|---|---|---|
| Reach | Valid, deduplicated exposure within the agreed audience and period | Did the campaign reach relevant people? |
| Engagement | Qualified visits, substantive reading and repeat use | Did the message earn meaningful attention? |
| Permission | Consented subscriptions and contact requests | Did exposure create a continuing relationship? |
| Qualification | Verified organizational role and relevant need | Are the contacts commercially appropriate? |
| Pipeline | Accepted meetings and documented opportunities | Did attention create credible demand? |
| Economics | Incremental gross profit, acquisition cost and payback | Was the investment effective? |
Use a holdout or another defensible incrementality method where feasible. Avoid claiming that every conversion following exposure was caused by the campaign. For long institutional sales cycles, use qualified pipeline as an interim indicator and reconcile it later to realized outcomes.
For example, a hypothetical $100,000 campaign producing 100 verified qualified meetings costs $1,000 per meeting. A $150,000 campaign producing 250 costs $600. The second is more efficient on that measure despite costing more overall. Neither is proven more effective until meeting quality and eventual business results are known.
I budget owned publishing as an operating capability: research, editorial work, technology, security, distribution and relationship management. My objective is to make those investments produce reusable knowledge and better commercial conversations. Full cost belongs in the calculation because I want the economic advantage to withstand scrutiny.
13The arithmetic of obsolescence: when a ratings lead becomes a misleading measure of scale
A number can be accurate while the commercial story built around it is incomplete. A network can lead its category, a presenter can win an hour, and a program can dominate its immediate competitors—without answering the question that matters to an enterprise buyer: how effectively does this placement connect us with the people who can move our business forward?
The supplied November 9, 2026 ranking places The Five first among the listed programs in adults 25–54, with an estimated 235,000 viewers. The accompanying hourly table reports 2.667 million total viewers. These are meaningful audiences within the measured U.S. television market. They are also bounded observations: a particular program, a particular date and a defined viewing window. [1]
My current indexed global footprint is 1.62B+, and my objective is 1.75B+ by the close of business on December 31, 2026. For numerical context alone, 235,000 is approximately 0.0145% of 1.62 billion, while 2.667 million is approximately 0.1646%.
Those percentages compare the sizes of different quantities. They do not measure equivalent reach, campaign delivery or advertising effectiveness. I use the published indexed-visibility definition for my footprint, while the television estimate represents viewing in its stated market and time window. The screenshot explicitly identifies Big Data + Panel measurement.
The strategic implication is about architecture. Domestic linear viewing and a global, cross-platform network offer different routes to attention. Before allocating capital, an enterprise must understand the geography, timing, duplication, audience relevance and activation capacity of each.
A ratings victory is an achievement inside a defined market. It is not, by itself, a complete distribution strategy.
Nor should we confuse impressions with people. One person can generate multiple impressions. A campaign delivering 100 million gross impressions has not necessarily reached 100 million unique individuals.
Consider a transparent illustration: at an assumed $28 CPM, 100 million gross impressions would cost $2.8 million in media expenditure. That is arithmetic using a hypothetical rate—not a current cable-news quote, a unique-reach forecast or proof of actual savings available through Limitless USA. Production, agency services and measurement may add costs. Audience overlap, negotiated terms and delivery guarantees change the result.
The sharper question is what the advertiser acquires beyond exposure. Does the campaign generate qualified interest? Does that interest become a permissioned relationship? Can the resulting knowledge improve the next engagement? Does useful intellectual property remain available after the paid placement ends?
For an institution making decisions over years, the cumulative value of those assets deserves a place in the investment discussion.
14Forty-plus years of execution at my largest indexed scale
My perspective comes from more than forty years of work across brands, agencies, technology and international markets. Today’s distribution strategy builds on that experience and on the commercial lessons learned through successive changes in how people discover, evaluate and buy.
Across my career, my work has included clients such as IBM, Microsoft, Coca-Cola, Unilever, Visa, American Express, P&G, AT&T, BMW, Porsche, Ferrari, Nike, Disney, Electronic Arts, British Airways, IMG and Douglas Elliman. That is career-wide experience earned through the agencies and businesses in which I worked. It is the operating background I bring to Limitless USA today.
Working across those categories teaches a discipline that survives changes in technology. An enterprise technology buyer needs evidence and integration confidence. A luxury client needs discretion and relevance. A financial-services organization needs trust and precise communication. A property decision can involve family priorities, professional advisers, ownership records and substantial capital.
A large audience becomes commercially useful when the message respects those differences.
Today, my indexed global footprint stands at its largest recorded scale: 1.62B+, with 1.75B+ targeted by the close of 2026. The ambition is to bring that distribution scale together with experience, substantive research and better ways to establish relevant relationships.
The Sovereign Ledger™ provides an inspectable body of work behind that proposition. My publishing baseline through report #201 is 3,057,781+ words across 201 entries; with this report, it reaches 202 entries. I put that accumulated work to use through the quality of the questions, the usefulness of the analysis, the clarity of the evidence and the willingness to correct an assertion when the facts require it.
I organize my institutional authority around four standards that prospective partners can inspect:
Experience: A career spanning more than four decades, multiple industries and international markets provides context for judging what is enduring and what is merely fashionable. I connect that history to the roles I held, the responsibilities I carried and the businesses I helped build.
Expertise: Understanding media economics requires distinctions between footprint and delivered reach, impressions and individuals, engagement and intent, and pipeline and realized value. Understanding ownership infrastructure requires equal precision about identity, authority, permissions and settlement.
Authority: An accessible corpus allows people to inspect the reasoning behind a strategic position. Useful research can earn attention repeatedly because it answers questions that remain important after the first publication.
Trust: I state the measurement, preserve the source and take responsibility for the argument. I set ambitious targets and report progress against them. I judge commercial work against agreed objectives. That consistency is how an institutional relationship becomes durable.
Truth precedes opinion. Evidence precedes assertion.
That standard is part of the proposition I bring to a partner. It allows ambition to stand alongside accountability.
The connection between experience and current work is visible in The Sovereign Ledger™ publishing record and in my published Provenance chronology. I keep building that record because institutional confidence grows when readers can inspect how an argument develops, where it has changed and how it applies to their own decisions.
15The sovereign advantage: building assets that outlast the media buy
For UHNWIs, family-office principals, CEOs, founders and venture capitalists, the opportunity is to build a more capable system for reaching relevant people and supporting consequential decisions. Limitless USA, the geoffdeweaver.com corpus and the REALATAR™ strategy offer complementary elements of that proposition.
Greater visibility into where capital goes
Every intermediary should be able to explain the value it adds. Strategic advice, production, distribution, measurement and governance can all justify expenditure. Unnecessary duplication and poorly explained charges deserve scrutiny.
I structure the case for direct partnership around transparent scope, responsibilities and deliverables. I want to identify avoidable handoffs, remove duplicated work and make the economics easier to evaluate. Every retained service should contribute something the client can recognize and assess.
My commitment is clear: establish the cost of the work, the expected deliverables and the evidence used to judge performance before deployment begins.
More relevant engagement with executive audiences
The audience priorities illustrated in my career materials include CEOs, board members, UHNWIs, HNWIs, venture capitalists, family trusts, luxury-market participants and other decision-makers.
Those categories need different engagement strategies. A family office assessing a long-duration ownership thesis needs substantive evidence. A founder seeking enterprise adoption needs a precise explanation of the customer’s problem. A luxury-market participant needs audience relevance and appropriate timing.
The objective is to design research and distribution around those decisions, then measure which relevant people actually engage. I connect indexed visibility to actual engagement records so that a partner can see which relevant contacts and opportunities the work is producing.
Intellectual property that can continue to work
A useful report can support a board discussion, help an adviser explain a difficult issue, inform a prospective partner and provide material for later conversations. Its value can extend beyond the initial distribution period.
That continuing usefulness requires maintenance. Research needs updates, links need checking, infrastructure needs protection and relationships need attention. Owned publishing is an operating asset with ongoing responsibilities.
The opportunity is to build a body of work that becomes more useful through revision, connection and application. Each campaign can then contribute to something the next campaign can use.
Provenance that supports verification
A valid Bitcoin-anchored OpenTimestamps proof lets a reader test a precise proposition: the matching document data existed by the recorded time. I use that capability to support an inspectable publication history and the integrity of retained versions. [12]
For institutional readers, this distinction is valuable. A dated, verifiable record can support version history and accountability. Backups, preservation practices and continuing access remain separate responsibilities.
I pair that evidence trail with maintenance, preservation and accountable publishing. Each layer has a defined job, and together they make the record easier to trust and use.
A disciplined connection to REALATAR™
REALATAR™ extends the strategic discussion into identity, authority, controlled evidence access and proposed ownership workflows. Its relevance to this report is the importance of moving from general awareness toward decisions supported by reliable information.
Publishing can explain the problem. Distribution can introduce relevant participants. A properly implemented workflow can help those participants evaluate evidence and exercise appropriate control.
I evaluate each stage through its own operating evidence: useful research, relevant introductions, working permissions and demonstrable workflow improvements. That is how I intend to turn a strategic architecture into a commercially useful capability.
16The cost of waiting: competitors can build relationships before you enter the conversation
The most credible urgency comes from the time required to build trust.
An organization that begins publishing useful analysis today can start learning which questions its market asks, which explanations earn attention and which relationships merit deeper investment. An organization that postpones the work postpones that learning too.
A competitor can use that time to become familiar to an audience, improve its evidence, refine its offer and establish permission to communicate again. When a buying decision eventually emerges, that earlier work may influence who receives the first call.
The cost of waiting can include the relationships you have not started, the knowledge you have not accumulated and the authority you have not yet earned.
I regard that lost learning time as a serious strategic cost. An organization that starts now can test its message, discover where the decision process stalls and improve its evidence before the next major buying cycle. The head start becomes valuable through disciplined execution. The same logic runs at national scale in America Must Win the AI Ownership Race (#197).
For leaders planning 2027, the practical response is to begin a defined, measurable program while there is time to learn. Identify the relevant decision-makers. Develop useful material around their needs. Agree on distribution responsibilities. Establish a baseline. Measure engagement, qualified conversations and eventual outcomes.
My 1.62B+ indexed global footprint is the current visibility baseline from which I am building. 1.75B+ by the close of business in 2026 is the next target. The ambition is larger than the number: to connect decades of experience with research, relationships and infrastructure that can create lasting commercial value.
Start with The Sovereign Ledger™, select the issue closest to your mandate, and bring that issue into a direct conversation. The next step should have a purpose, an accountable owner and a clear definition of progress.
I invite CEOs, family-office principals, UHNWIs, venture capitalists and prospective enterprise partners to connect through geoffdeweaver.com.
Bring a specific growth challenge, an audience you need to engage and an outcome worth measuring. We can examine where your current approach creates value, where unnecessary costs or handoffs arise, and whether a focused partnership can build capabilities you retain.
Your Reading Route: The Reports That Build This Case
- The Global Distribution Advantage™Where I first set my footprint against cable-news audiences.
- #198 — Global Advertising Strategy 2026Compare every channel on cost per qualified outcome and test it in 90 days.
- #201 — The Next Real Estate Advantage and the Sovereign Growth Loop™How intelligence, trust and relationships compound into ownership infrastructure.
- #200 — The Spatial StandardHow REALATAR™ deploys programmable asset rails across global real estate.
- #199 — The Intermediation Thesis™Find avoidable cost, run a 90-day pilot and check every claim.
- #197 — America Must Win the AI Ownership RaceWhy owning the infrastructure first decides who sets the terms.
- #192 — Real Estate Digital Disruption 2026Prove what your technology improves, then fund it.
- #181 — The Sovereign Control Plane™ StandardIdentity, delegated authority and permissions for family offices.
- #171 — The Global Distribution Control Layer™The control logic behind my distribution grid.
Forty-plus years of execution. My largest indexed footprint to date. Building the next stage of institutional growth for 2027 and beyond.
Sources and verification notes
Research date: November 12, 2026 (ET). My analysis keeps daily, monthly, quarterly and annual observation windows separate. Percentage calculations use the stated source values and may reflect rounding. Cost scenarios are illustrative models; commercial proposals require agreed prices, deliverables and performance measures.
- Data, research & graphics: November 9, 2026 total/daypart chart, hourly evening table, dayside table and demo ranking. Screenshots attribute data to Nielsen Big Data + Panel, L+SD. Source basis: the supplied graphics, rather than an original Nielsen export. CNN’s 7 a.m. demo differs between panels: 79,000 in the dayside table and 71,000 in the ranking. The primetime calculations are unaffected.
- ADWEEK/TVNewser, June 2026 ratings: adweek.com/tvnewser/here-are-the-cable-news-ratings-for-june-2026/
- TV Insider, Q3 2026 ratings, October 2: tvinsider.com/1294583/cnn-ms-now-fox-news-third-quarter-2026-ratings-revealed/
- Leichtman Research Group, 2016 provider results: leichtmanresearch.com — Research Notes 2017-03 (PDF)
- Leichtman Research Group, 2023 provider results: leichtmanresearch.com — Research Notes 1Q 2024 (PDF)
- Comcast, year-end 2016 results: cmcsa.com — 4th Quarter and Year-End 2016 Results
- Comcast, Q3 2026 results (10.394 million domestic video customers vs. 11.515 million a year earlier): cmcsa.com — 3rd Quarter 2026 Results
- Pew Research Center, cable/satellite use, 2015–2021: pewresearch.org — cable and satellite TV use
- Nielsen, May 2025 streaming milestone: nielsen.com — Streaming Reaches Historic TV Milestone
- Pew Research Center, historical cable-news data: pewresearch.org/journalism/fact-sheet/cable-news/
- Dentsu, May 2026 advertising forecast: insight.dentsu.com/ad-spend-may-2026/
- OpenTimestamps, proof scope and verification: opentimestamps.org — consulted November 12, 2026.
- The Sovereign Ledger™: geoffdeweaver.com/the-sovereign-ledger/ — publishing inventory and indexed-visibility definition. Baseline through #201: 3,057,781+ words and 201 reports. The public page distinguishes Boolean search-result snapshots from people and identifies year-end visibility as a target.
- Professional history and operating architecture: Geoff De Weaver’s career account, client-history graphic and Command Center specification; geoffdeweaver.com/provenance/ for the published chronology and measurement framework. The 34-person agency build, nine-month period, $2 million PBT and 35% margin are autobiographical operating figures. The OzEmail reference describes work in its NASDAQ era; individual responsibility for its IPO is not established by the sources reviewed.
- ADWEEK/TVNewser, October 2026 ratings (Fox News 1,675,000; MS NOW 925,000; CNN 598,000 primetime total viewers): adweek.com/tvnewser/cable-news-ratings-october-2026/
- ADWEEK/TVNewser, Q2 and Q3 2026 ratings (Q2 primetime: 2,493,000 / 1,063,000 / 711,000; Q3: 2,064,000 / 933,000 / 608,000): Q2 2026 · Q3 2026
- NewscastStudio, “Fox ratings fall 27% in October as CNN, MS NOW post gains” (October 28, 2026), citing Emplifi data provided by Fox News: newscaststudio.com/2026/10/28/fox-ratings-fall-1026/
- Statista Market Insights — Real Estate, Worldwide (2026 forecast): statista.com
Historical clients describe career experience. The 1.62B+ figure describes indexed visibility, 1.75B+ is the December 31 target, and campaign delivery is measured separately. OpenTimestamps supports document existence and integrity; research accuracy, operational availability and commercial performance require their respective evidence. This is the measurement framework I use throughout the report.
SOURCES, CORRECTIONS & RIGHTS
Fact, Forecast and Opinion
Dated ratings, subscriber counts, survey results and corporate disclosures in this Entry are sourced above. Forecasts are projections, not facts; Dentsu’s global forecasts are not observed U.S. cable-news budget movements. Cost scenarios are illustrative. Frameworks, doctrines and forward-looking interpretations — including The Ownership Thesis™, the Command Center architecture, the Sovereign Control Plane™ and REALATAR™ roadmaps — are my own analysis and opinion.
Companies, Institutions & Brands Referenced
- Nielsen — https://www.nielsen.com
- Fox News — https://www.foxnews.com
- MS NOW (formerly MSNBC) — https://www.ms.now
- CNN — https://www.cnn.com
- ADWEEK / TVNewser — https://www.adweek.com
- TV Insider — https://www.tvinsider.com
- NewscastStudio — https://www.newscaststudio.com
- Emplifi — https://emplifi.io
- YouTube — https://www.youtube.com
- Leichtman Research Group — https://leichtmanresearch.com
- Comcast Corporation (NASDAQ: CMCSA) — https://corporate.comcast.com
- Pew Research Center — https://www.pewresearch.org
- dentsu — https://www.dentsu.com
- Statista — https://www.statista.com
- Omnicom Group — https://www.omnicomgroup.com
- Nasdaq — https://www.nasdaq.com
- OzEmail — historical brand (acquired by WorldCom, 1999); no current corporate website
- IBM — https://www.ibm.com
- Microsoft — https://www.microsoft.com
- The Coca-Cola Company — https://www.coca-colacompany.com
- Unilever — https://www.unilever.com
- Visa — https://www.visa.com
- American Express — https://www.americanexpress.com
- Procter & Gamble (P&G) — https://us.pg.com
- AT&T — https://www.att.com
- BMW — https://www.bmw.com
- Porsche — https://www.porsche.com
- Ferrari — https://www.ferrari.com
- Nike — https://www.nike.com
- The Walt Disney Company — https://thewaltdisneycompany.com
- Electronic Arts — https://www.ea.com
- British Airways — https://www.britishairways.com
- IMG — https://www.img.com
- Douglas Elliman — https://www.elliman.com
- X — https://x.com
- LinkedIn — https://www.linkedin.com
- Bitcoin — https://bitcoin.org
- OpenTimestamps — https://opentimestamps.org
Proprietary Intellectual Property & Frameworks
The following research, frameworks and intellectual property were independently developed by Geoff De Weaver and Limitless USA LLC:
- The 0.0145% Illusion — this Entry
- REALATAR™ — https://geoffdeweaver.com/realatar/
- The Ownership Thesis™ — https://geoffdeweaver.com/ownership-infrastructure/
- LIMITLESS GLOBAL™ — The Global Distribution Advantage™ and Strategic Return on Attention™ — https://geoffdeweaver.com/global-distribution-advantage/
- Provenance — https://geoffdeweaver.com/provenance/
- Limitless USA LLC · Geoff De Weaver — https://geoffdeweaver.com/
Cross-Referenced Sovereign Ledger™ Entries
- #201 — The Next Real Estate Advantage: AI, Blockchain & the De Weaver Sovereign Growth Loop™ — geoffdeweaver.com
- #200 — The Spatial Standard — geoffdeweaver.com
- #199 — The Intermediation Thesis™ — geoffdeweaver.com
- #198 — Global Advertising Strategy 2026 — geoffdeweaver.com
- #197 — America Must Win the AI Ownership Race — geoffdeweaver.com
- #192 — Real Estate Digital Disruption 2026 — geoffdeweaver.com
- #181 — The Sovereign Control Plane™ Standard — geoffdeweaver.com
- #171 — The Global Distribution Control Layer™ — geoffdeweaver.com
- Full Ledger Index (202 entries, 3.06M+ verified words, Bitcoin-anchored) — https://geoffdeweaver.com/the-sovereign-ledger/
Corrections
If you believe any fact in this Entry is inaccurate, write to geoff@geoffdeweaver.com with the claim and a source. Verified corrections are published with a dated note; the original anchored version is preserved.
Not Advice
Nothing in this Entry is legal, financial, tax, investment or media-buying advice, or an offer to buy or sell any security, token or property. Consult qualified professionals before acting.
Rights & Notices
© 2026 Geoff De Weaver and Limitless USA LLC. All rights reserved. This is a human-authored work. The Sovereign Ledger™, The Ownership Thesis™, REALATAR™, LIMITLESS GLOBAL™, The Global Distribution Advantage™, Strategic Return on Attention™, The Sovereign Control Plane™, Sovereign Growth Loop™, OWN YOURSELF™, Earth 3.0™ and related marks are trademarks of Geoff De Weaver and Limitless USA LLC. Third-party names, logos and images belong to their respective owners and are referenced for news reporting, commentary and identification only; no endorsement or commercial relationship is implied.
No license is granted to copy, scrape, mine, republish, commercially reuse, or use this content to train, fine-tune or develop artificial intelligence systems without written permission, except as permitted by applicable law. Text-and-data-mining and AI-training rights are expressly reserved, including under Article 4(3) of EU Directive 2019/790. Brief quotation with attribution and a link to the canonical URL is welcome.
Provenance: this Entry’s canonical fingerprint is hashed with SHA-256 and committed through OpenTimestamps to the Bitcoin blockchain, establishing chronology and integrity of the published record.
SOVEREIGN PROOF
CANONICAL FINGERPRINT STRING:
THE SOVEREIGN LEDGER™ | ENTRY #202 | THE 0.0145% ILLUSION: WHY SMART CAPITAL IS ABANDONING LEGACY CABLE FOR 1.75B+ SOVEREIGN SCALE | GEOFF DE WEAVER | LIMITLESS USA LLC | 2026-11-13 | CORPUS: 202 ENTRIES | https://geoffdeweaver.com/0-0145-percent-illusion-legacy-cable-advertising/
SHA-256:
10d6d9339f0357294c40def5c47c2486a7cba83d525c9e288ec21e9594fa8530
OPENTIMESTAMPS PROOF: entry-202-0-0145-percent-illusion-legacy-cable-advertising.txt.ots
STATUS AT PUBLICATION: Submitted to OpenTimestamps calendars · Bitcoin block confirmation pending
FULL-TEXT SHA-256: Sealed after publication against the canonical published-body .txt
This file’s SHA-256 is committed through OpenTimestamps. Once confirmed in a Bitcoin block, the proof shows that this exact document existed at or before that block time and has not been altered. The timestamp does not grant a license, transfer copyright, or replace registration.

One institution. Four destinations. One Sovereign Architecture.
I have spent decades building an integrated infrastructure designed for absolute ownership:
IDENTITY. SCALE. INTELLIGENCE. INFRASTRUCTURE.
Driven by the LIMITLESS doctrine:
OWN IT → PROTECT IT → PROVE IT → CONTROL IT → MULTIPLY IT → COMPOUND IT.
AI scales leverage. Blockchain secures provenance. Evidence establishes trust. Human authority guarantees sovereignty. Better products build the moat.
Who I Am commands attention.
My Track Record validates scale.
How I Think cements trust.
What I’m Building drives adoption.
This is the architecture.