
LIMITLESS GLOBAL™
THE GLOBAL DISTRIBUTION ADVANTAGE™
For decades, Fortune 500 companies, financial institutions, luxury brands, political campaigns, venture-backed companies and global advertisers have paid extraordinary premiums for one scarce commodity: attention.
I have spent more than four decades buying it, selling it, engineering it and building distribution around it — across Madison Avenue, Silicon Valley and global markets. In 2026, I believe the economics of reach have fundamentally changed.
THE 1.55 BILLION+ AUDIENCE ARBITRAGE
US CABLE NEWS IS A ROUNDING ERROR.
THE FUTURE OF DISTRIBUTION IS HORIZONTAL.
The strategic question is no longer simply, “How many impressions can we buy?” It is: “How much strategically relevant reach, connectivity, intelligence and commercial leverage can we create for every dollar deployed?”
FIRST, THE METHODOLOGY
PRECISION MAKES THE COMPARISON MORE POWERFUL
A Nielsen primetime average and my reported 1.55 billion+ global network/reach footprint are different measurement constructs. Nielsen’s television figures estimate average concurrent viewing during defined television periods. My 1.55B+ figure is a reported LinkedIn Boolean-search-derived reach/addressable-universe proxy, tracked as a dated series since August 2019 — not 1.55 billion simultaneous viewers or unique direct connections.
That distinction matters. The comparison below therefore measures relative numerical scale, not equivalent audiences. For institutional decision-makers, that is precisely the point: a domestic linear television audience and a worldwide distribution footprint represent fundamentally different architectures for reaching markets.
Four Decades of Distribution Compounding™
Career provenance. Measured evidence. 2026 target.
The Foundation Arc
Career infrastructure · not plotted as reach
- 1985Miami UniversityOxford, Ohio · career foundation
- 1996OzEmail / NASDAQInternet-market infrastructure
- 1999Web1 / Omnicom · San FranciscoGlobal digital distribution
- 2011Owned publishing beginsgeoffdeweaver.com · public writing online since 2007
Measured Network / Reach Proxy
Aug. 2019–Dec. 2025 observed series · 2026 target shown separately · bars on a 0–2.0B scale
-
Aug. 2019 · first observation622M
-
Dec. 2025 · reported footprint1.55B+
-
2026 year-end · target, not observed1.75B+
The 1.55B+ figure is a reported LinkedIn Boolean-search-derived reach/addressable-universe proxy—not unique direct connections or simultaneous audience. 2026 is a target, not a forecast.
From Miami University, Oxford, Ohio, in 1985, through Web1, global enterprise distribution, social-platform receipts and a growing Bitcoin-anchored research record, the operating history is real and documented.
The chart deliberately separates two different records. The left rail is career provenance: the organizations, markets and operating milestones that built the foundation. The right pane is the dated LinkedIn Boolean-search-derived reach/addressable-universe proxy series, measured from August 2019 onward. It is not a claim of unique direct connections, simultaneous viewers or guaranteed campaign delivery.
The 2026 figure is a stated 1.75B+ year-end target—not observed data. OpenTimestamps and Bitcoin establish publication-time integrity and chronology of the fingerprinted record; they do not independently verify the underlying search figures.
AUGUST 20, 2026
THE NUMBERS DON’T LIE
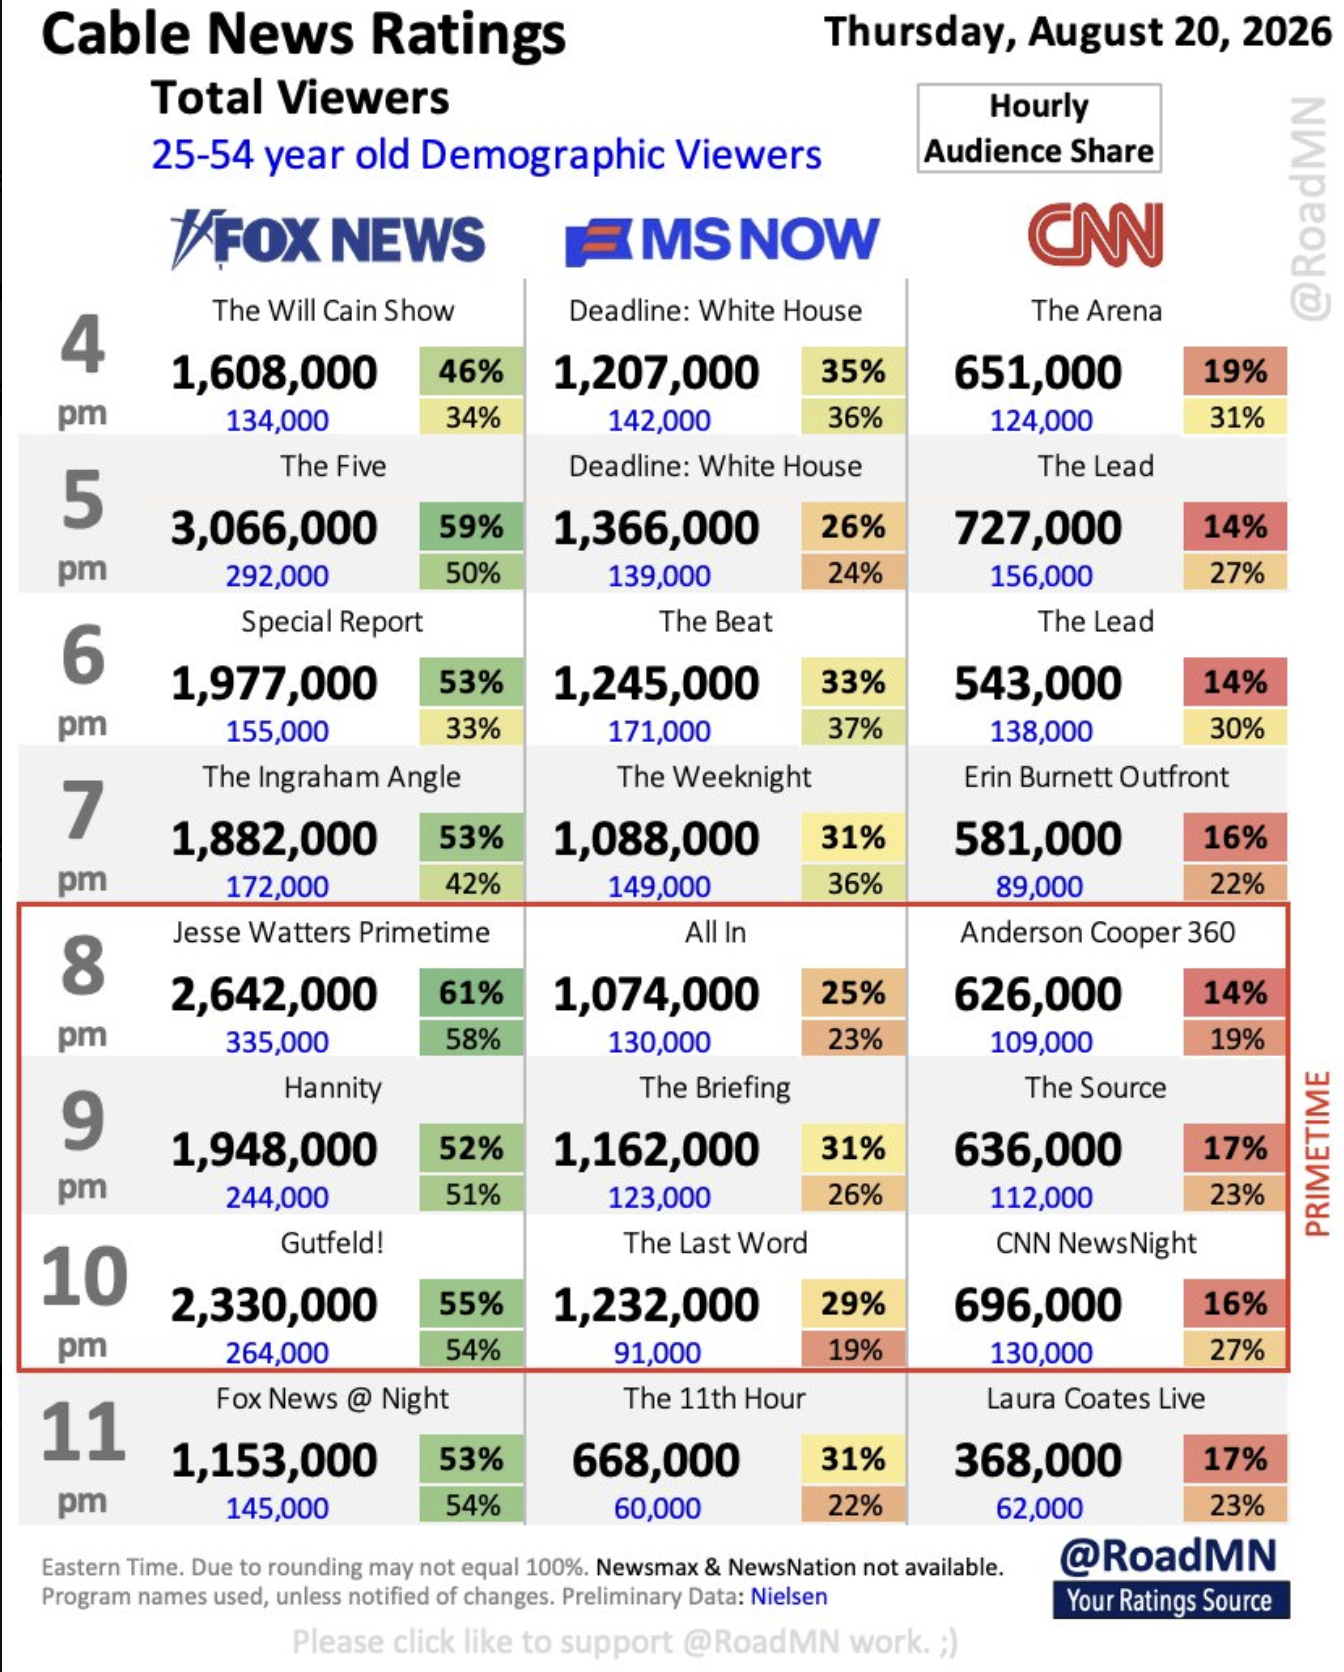
Using the preliminary Nielsen Media Research figures displayed in the August 20, 2026 RoadMN ratings graphic, the 8–10 p.m. averages calculate as follows.
FOX NEWS
2,306,667
Average 8–10 p.m. viewers · approximately 672× smaller than 1.55B+ in numerical scale · 0.1488% of 1.55B
MS NOW
1,156,000
Average 8–10 p.m. viewers · approximately 1,341× smaller than 1.55B+ in numerical scale · 0.0746% of 1.55B
CNN
652,667
Average 8–10 p.m. viewers · approximately 2,375× smaller than 1.55B+ in numerical scale · 0.0421% of 1.55B
FOX NEWS + MS NOW + CNN
4,115,334
Combined average 8–10 p.m. audience
≈ 0.266% OF THE NUMERICAL SCALE OF 1.55 BILLION
My reported 1.55B+ network/reach footprint is approximately 377× that combined average.
THIS IS NOT ABOUT WHO WINS CABLE NEWS
IT IS ABOUT THE ECONOMICS OF DISTRIBUTION
Fox News remains a powerful force within US cable news. On August 20, its 8 p.m. program, Jesse Watters Primetime, recorded approximately 2.642 million total viewers in the supplied preliminary data. The Five recorded approximately 3.066 million at 5 p.m.
The strategic issue for a Fortune 500 CMO, CEO, venture capitalist, family office or global luxury brand is therefore not whether television can still produce audience. It can. The question is whether legacy linear distribution should continue receiving disproportionate capital when global, cross-platform and relationship-driven distribution architectures can create entirely different forms of reach and strategic leverage.
JULY WAS THE SIGNAL. AUGUST REINFORCED IT.
On July 23, 2026, the comparable primetime averages supplied were:
FOX NEWS — 2.549M
MS NOW — 1.102M
CNN — 726,333
The August reading matters because it reinforces the structural observation: US cable news is competing intensely for a few million concurrent viewers while global digital distribution operates across a fundamentally broader addressable landscape.
FRIDAY, AUGUST 21, 2026 · 6 A.M.–MIDNIGHT ET AVERAGE
THE PATTERN HOLDS AT FULL-DAY SCALE
Preliminary Nielsen data for the full broadcast day tells a consistent story about the concentration — and the ceiling — of U.S. cable-news audiences. Fox News averaged 1,520,056 total viewers across the day, versus 789,056 for MS NOW and 455,778 for CNN.
MS NOW + CNN combined: 1,244,834
Fox News alone was approximately 22.1% larger than both competitors combined.
The same pattern held in the 25–54 demographic: Fox averaged 169,611, versus a combined 152,722 for MS NOW (86,111) and CNN (66,611) — Fox still approximately 11.1% larger than both together. Audience-share data for the day put Fox at 55% of total-viewer share and 53% of demo share — a majority against two competitors combined.
Set beside my reported 1.55 billion+ global network/reach footprint: the three networks shown averaged approximately 2,764,890 combined total viewers across the day. In numerical scale, 1.55B is approximately 561× that combined figure, and approximately 1,020× Fox News’ own total-viewer average.
These are not equivalent audience metrics. Nielsen measures average television viewers across a defined day; my 1.55B+ figure is a reported LinkedIn Boolean-search-derived reach/addressable-universe proxy. The comparison measures numerical scale, not identical measurement methodology — a distinction I hold to deliberately.
THE 25–54 DEMOGRAPHIC MAKES THE CONTRAST EVEN SHARPER
Across the same 8–10 p.m. period on August 20, the supplied figures produce average 25–54 audiences of:
FOX NEWS — 281,000
MS NOW — 114,667
CNN — 117,000
For sophisticated marketers, this is where the capital-allocation discussion becomes especially important. Premium media economics have historically been built around access to valuable demographic segments. But the modern enterprise increasingly needs something beyond demographic exposure: access to decision-makers, investors, founders, operators, UHNWIs, family offices, institutional capital and globally connected commercial networks.
FROM CPM TO STRATEGIC RETURN ON ATTENTION
Advertising spent decades optimizing cost per thousand impressions. For institutional-scale businesses, I believe that calculation is increasingly incomplete.
The more consequential metric is Strategic Return on Attention™: how much durable business value can be created from every unit of attention purchased, earned, activated or owned?
One strategically relevant relationship with a billionaire, sovereign allocator, family-office principal, venture capitalist, CEO or institutional decision-maker can be commercially more consequential than enormous volumes of anonymous impressions. Scale matters. But scale + relevance + trust + relationships + technology + ownership is a much more powerful equation.
WHAT SHOULD FORTUNE 500 LEADERS BE ASKING?
Can we create more strategically relevant reach with less capital?
Can we reach more decision-makers instead of simply buying more impressions?
Can we create relationships instead of repeatedly renting temporary attention?
Can marketing expenditure generate intellectual property, data, relationships and infrastructure that survive the campaign?
CAN WE TURN MARKETING FROM RENTED ATTENTION INTO OWNED STRATEGIC INFRASTRUCTURE?
40+ YEARS AT THE INTERSECTION OF BRANDS, TECHNOLOGY AND DISTRIBUTION
This thesis did not begin with social media, AI or Web3. It is the continuation of more than four decades spent working across advertising, direct marketing, digital transformation, technology, media and global commercial strategy.
Across that career, my professional work has involved major enterprises and brands including IBM, Microsoft, AT&T, Visa, Coca-Cola, BMW, Porsche, P&G, Unilever, Cisco, Disney, Nestlé, American Express, British Airways, McDonald’s, Nissan, Dell, Pfizer, BP and others.
The technologies changed. The fundamental commercial problem did not: how do you connect the right organization, idea, asset or opportunity with the right people — more intelligently, more efficiently and with less friction?
BUILT FOR PEOPLE WHO ALLOCATE CAPITAL AND MOVE MARKETS
LIMITLESS GLOBAL™ is designed around commercially consequential relationships and distribution — not anonymous traffic for traffic’s sake.
FORTUNE 500 CEOs & CMOs
VENTURE CAPITALISTS
FAMILY OFFICES
BILLIONAIRES & UHNWIs
BOARD MEMBERS & C-SUITE EXECUTIVES
INSTITUTIONAL INVESTORS
GLOBAL REAL ESTATE LEADERS
LUXURY & AUTOMOTIVE BRANDS
BANKING & FINANCIAL SERVICES
AIRLINES & TRAVEL
TECHNOLOGY & TELECOMMUNICATIONS
GLOBAL DECISION-MAKERS
THE REAL PROPOSITION
I operate across a reported 1.55 billion+ global network/reach footprint and combine that distribution scale with more than four decades of Madison Avenue, Silicon Valley and international commercial experience.
Traditional media sells access to an audience for a defined period. My strategic objective is different: create relationships, distribution architecture, intellectual property and commercial infrastructure capable of continuing to produce value after an individual campaign ends.
THAT IS NOT SIMPLY A MEDIA BUY.
IT IS A DIFFERENT MODEL OF DISTRIBUTION.
THE AUGUST 2026 DISTRIBUTION GAP — AT A GLANCE
The visual below places the August 20 cable-news data into the broader distribution context driving this thesis.
THE AUGUST 2026 BOTTOM LINE
1.55 BILLION+
REPORTED GLOBAL NETWORK / REACH FOOTPRINT
versus
2.307M — FOX NEWS AVG. 8–10 P.M.
1.156M — MS NOW AVG. 8–10 P.M.
652,667 — CNN AVG. 8–10 P.M.
≈ 377× THE COMBINED AVERAGE AUDIENCE OF ALL THREE
The future is not about spending the most money to rent the most attention. It is about creating the greatest strategic leverage from every dollar deployed — and owning more of the infrastructure underneath it.
LIMITLESS GLOBAL™
STOP RENTING ATTENTION.
START BUILDING STRATEGIC LEVERAGE.
For Fortune 500 companies, venture capital firms, family offices, UHNWIs, global real estate leaders and institutional decision-makers seeking a more intelligent approach to distribution, connectivity and ownership infrastructure.
One institution. Four destinations. One Sovereign Architecture.
I have spent decades building an integrated infrastructure designed for absolute ownership:
IDENTITY. SCALE. INTELLIGENCE. INFRASTRUCTURE.
Driven by the LIMITLESS doctrine:
OWN IT → PROTECT IT → PROVE IT → CONTROL IT → MULTIPLY IT → COMPOUND IT.
AI scales leverage. Blockchain secures provenance. Evidence establishes trust. Human authority guarantees sovereignty. Better products build the moat.
Who I Am commands attention.
My Track Record validates scale.
How I Think cements trust.
What I’m Building drives adoption.
This is the architecture.
#GeoffDeWeaver #REALATAR #TheSovereignLedger #LIMITLESS #SovereignArchitecture #AI #Bitcoin #Blockchain #UHNWI #Florida
GEOFF DE WEAVER
Researcher · Architect · Limitless USA LLC
Architect of The Ownership Thesis™ & REALATAR™
Building Horizontal Liquidity Rails for the $625T Global Real Estate Market | AI • Web3 • T-0 Atomic Settlement
METHODOLOGY & SOURCE NOTE
Cable-news figures are calculated from the preliminary Nielsen Media Research data displayed in the supplied Thursday, August 20, 2026 ratings graphic attributed to RoadMN. The 8–10 p.m. network averages are arithmetic means of the three hourly program audiences at 8 p.m., 9 p.m. and 10 p.m. A global network/reach figure and a Nielsen average concurrent television audience are different measurement constructs and are not represented here as equivalent unique or simultaneous audiences. Multiples and percentages on this page compare numerical scale, not identical measurement methodologies. Newsmax and NewsNation were not available in the supplied source data. A second dataset referenced elsewhere on this page — Friday, August 21, 2026 — reflects RoadMN’s full-day average (6 a.m. to Midnight ET), a distinct measurement window from the August 20 8–10 p.m. primetime average above; the two are presented separately and should not be read as the same time period.
VERIFIABLE PUBLICATION PROVENANCE
This publication is designed for SHA-256 fingerprinting and OpenTimestamps (OTS) anchoring to Bitcoin for independently verifiable timestamp and publication-provenance evidence. Bitcoin/OpenTimestamps evidence establishes cryptographic timestamp/provenance; it does not itself establish legal title, legal ownership or regulatory status.
SOURCES, CORRECTIONS & RIGHTS
Fact and opinion. Cable-news figures are measured data from the preliminary Nielsen Media Research figures described in the Methodology & Source Note. The 1.55B+ figure is a reported LinkedIn Boolean-search-derived reach/addressable-universe proxy, and 1.75B+ is a stated 2026 year-end target, not observed data. Strategic Return on Attention™, the capital-allocation argument and the conclusions on this page are my strategic interpretation, not measured fact.
Corrections. If you find an error, email geoff@geoffdeweaver.com and I will correct the record with a dated note. Nothing here is legal, financial, tax or investment advice. Dates are Eastern Time.
© 2026 Limitless USA LLC and Geoff De Weaver. All rights reserved. Human-authored work of Geoff De Weaver. LIMITLESS GLOBAL™, The Global Distribution Advantage™, Strategic Return on Attention™, Four Decades of Distribution Compounding™, The T-0 Settlement Protocol™, The Gateway Competition Blueprint™, The Post-Quantum Ownership Standard™, The Capacity–Limits Test™, The Powell Housing Paradox™, REALATAR™, The Ownership Thesis™ and The Sovereign Ledger™ are trademarks of Geoff De Weaver and Limitless USA LLC. No license is granted to copy, scrape, mine, republish or use this content to train, fine-tune or develop artificial intelligence systems without written permission, except as permitted by law. Text-and-data-mining and AI-training rights are expressly reserved, including under Article 4(3) of EU Directive 2019/790. Brief quotation with attribution and a link is welcome.
Provenance. SHA-256 hashes and OpenTimestamps proofs anchored to Bitcoin establish chronology and integrity; they do not grant a license, transfer copyright or replace registration.